
Kits Beach, Vancouver, BC (photo by Nina Munteanu)
I travelled to over fifty countries in the world. I traveled every continent, except Antartica (which is on my bucket list). I walked. I cycled, took the bus, train, boat, car. I hiked through wilderness and clear-cut forest. I drove past miles of sunflower pastures overlooked by immense wind generators. I climbed snow-covered mountains and skimmed over oceans in a catamaran. I lingered in small villages, inhaling the intoxicating scent of baking bread, and navigated the ordered mayhem of some of the world’s largest cities.
I’ve traveled Canada’s vast and diverse terrain from coast to coast over a dozen times.
I grew up in the small rural town of Granby in the Eastern Townships of Quebec. I started my environmental career as a limnologist and raised a family in the coastal city of Vancouver, British Columbia. I cemented my writing career in Lunenburg, Nova Scotia. I currently live and teach writing in Toronto, Ontario.

Lunenberg, NS (photo by Nina Munteanu)
Of late, I’ve been in search of green.
Not just any green. Of course, I’m thinking of the vibrant multi-textured green of forest, woodland, marsh and field. But I’m also thinking of the green way of thinking: green infrastructure; green economies; sustainability; cooperation, commensalism, symbiosis, kindness. My landscape architect son tells me I can find such green anywhere, even in the city. He’s right, but not necessarily a city in Canada. More on that subject later. When it comes to green economies and infrastructure, we are lagging way behind Europe, particularly Scandinavia.
In 2016, Jeremy Tamanini et al. of Dual Citizen LLC released the 5th edition of the Global Green Economy Index (GGEI), an in-depth look at the performance of 80 countries and 50 cities moving toward environmentally friendly economies. The GGEI looked at how their performance was perceived by experts next to how they actually performed. Insights from the GGEI inform policymakers, international organizations, stakeholders and citizens like you and me with intelligence to advance the reputation and performance of a country and city in our greening economy.
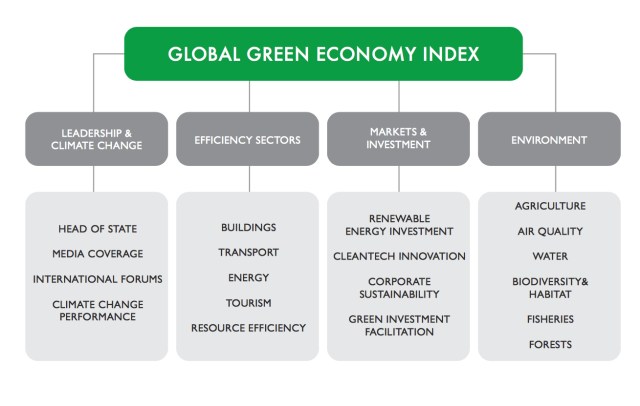
The GGEI Performance Index relies on 32 indicators within the four main areas of: 1) leadership & climate change; 2) efficiency sectors; 3) markets & investment; and 4) the environment (biodiversity and protection).
 TOP PERFORMERS
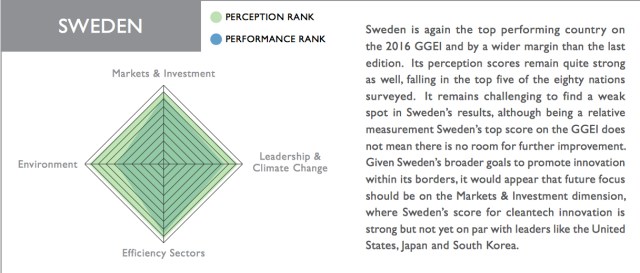
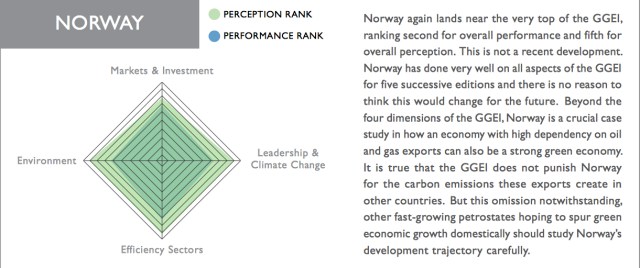
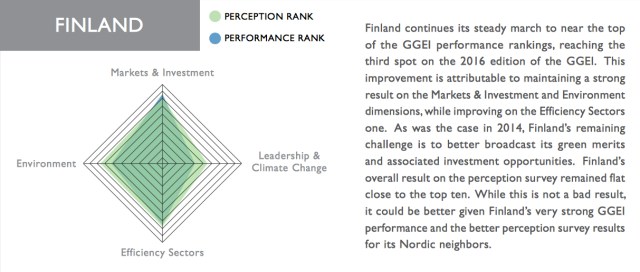
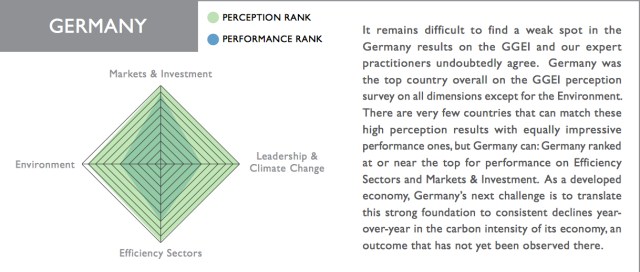
Scandinavian countries were clear leaders. Sweden and Norway headed the list of actual performance, with Finland, Switzerland, and Germany rounding out the top five performing green countries (scoring over 0.65 out of one).

LAGGARDS
Indonesia, Estonia, Kuwait, Qatar, Mongolia and Saudi Arabia bring up the rear in slots 75-80. China is not far above them at 64th place. The U.S. came in close to the middle, ranked 30 (score of 0.51), yet its perceived performance was second (score of 0.95), after Germany.
No country in Asia ranks well for performance on the 2016 GGEI, with the exception of Cambodia, which was the most improved country from 2014, rising 22 spots to 20th overall. China, India, Indonesia, Japan and South Korea do better on the perception side of the GGEI; in fact, they continue to register concerning performance results.
“While many European Union (EU) members perform near the top in the 2016 GGEI, others such as Czech Republic, Estonia, Poland, Romania and Slovakia rank near the bottom. These results are worrisome and suggest uneven national green performance across the EU.”–GGEI, 2016
Many of the fastest growing economies in the world aren’t growing green economies according to the GGEI performance measure. Regionally, these countries are mostly in Africa (Ghana), the Gulf (Qatar, United Arab Emirates), and Asia (Cambodia, China, Thailand, Vietnam). Countries with high annual GDP growth today that rank poorly on the GGEI, reinforce the limits of GDP as a growth indicator. Countries with a high reliance on fossil fuel extraction and export generally perform poorly on the GGEI, with a few exceptions. Kuwait, Qatar, Saudi Arabia and Russia all perform poorly while Norway and Canada do much better.
EMERGING AND CONTINUING TRENDS

Ganges River, India
Rapidly growing economies such as China and India continue to show performance weakness on the GGEI Markets & Investment dimension. Given the large investment required to achieve their climate targets, green investment promotion, cleantech innovation, and corporate sustainability need to be developed further.
The United States ranks near the top of the GGEI perception survey and it is widely viewed as a vital market for green investment and innovation; yet overall the U.S. continues to have mediocre performance results, ranking 30th of the 80 countries covered.–GGEI, 2016
However, the GGEI found that U.S. company-level initiatives to green supply chains and reduce carbon footprints are accelerating.
Despite having a new prime minister, Australia continues to register a poor result in the 2016 GGEI, ranking 55th of the 80 countries covered for performance. While green markets there are showing some strength, the overall carbon intensity of the Australian economy remains extremely high.
Hosting the annual Conference of Parties (COP) can positively impact the host country’s green brand. Yet this short-term image boost does not always translate to improved green performance in the longer-term, as demonstrated by the low GGEI performance results for Poland (COP19), Qatar (COP18) and South Africa (COP17).
The United Kingdom’s GGEI performance continues to lag behind its EU peers, ranking 25th of the 80 countries covered. While the UK does very well on both the perception and performance side of the Markets & Investment dimension, inconsistent policies supporting renewable energy and green growth continue to hurt the UK on other parts of the GGEI.
PERCEIVED VS. ACTUAL PERFORMANCE
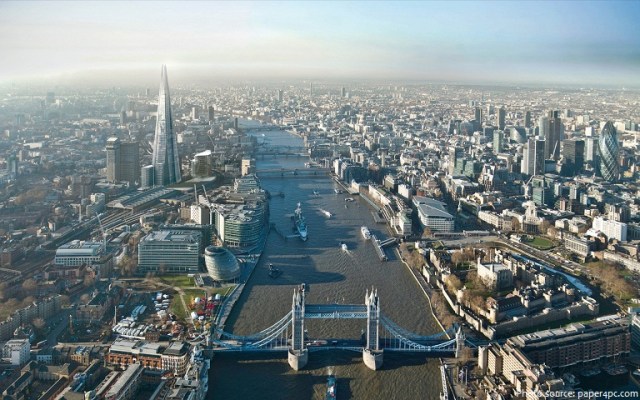
River Thames, United Kingdom
Notable discrepancies between actual performance and perceived performance occurred with several developed countries. The United States perception score was at 2nd place but its actual performance rank was 30th place. Other countries with overly-perceived performance include: Japan (perceived at 9th; performed at 34th), Australia (perceived at 16th place; performing at 55th place), United Kingdom (perceived at 7th place; performed at 25th place) and Canada (perceived at 6th place; performed at 12th)
Five European nations—Austria, Iceland, Ireland, Portugal and Spain—are doing better than perceived. Various non-European states—including Ethiopia, Mauritius, Rwanda, Colombia, Chile and Peru—also need to better position their better-than-perceived green economies.
CANADA’S PERFORMANCE
Canada, ranked 12th (at a score of 0.58) in the GGEI mostly because it scored the highest (0.90) in the Social Progress Index (SPI), beating the highest ranked on the GGEI. The SPI measures national social performance along three main dimensions: basic human needs; foundations of well-being; and opportunity.
Climate Change Leadership & Performance
Canada’s actual rank in climate change leadership was far below its perceived 9th position. The GGEI aggregates three emission intensity measures to define climate change performance: 1) emissions per capita; emissions per unit of GDP; and emissions per unit of primary energy. According to GGHEI calculations, Canada is one of several countries (including Brazil, India, Indonesia, and Japan) who have increased their emissions per unit of GDP since 2014.
Efficiency Sectors

LEED certified building (UTC Library) Toronto
Increasing the role of renewable energy and energy efficiently in buildings, energy and transportation reduces associated emissions and catalyzes green growth in the overall economy. The extent to which LEED-certified sustainable building has penetrated each country’s construction sector is one example. Canada, along with Norway, performed well mostly because of high levels of domestic renewable energy—despite the global emissions linked to their oil and gas exports. Canada did not score well in emissions from the transport sector. Iceland, Japan and Greece reduced their emissions by over 15%; while China (+191%) and India (+137%) experienced significant increases.
Markets and Investment
With respect to green markets and investment flows, Japan—while revealing mediocre results overall on the GGEI—was in the top 10 for both perception and performance. China continues to install new renewable energy capacity at a rapid rate, but has a long way to go to achieve a high rank in this metric; the United States, while perceived in the top 10 lags below (likely due to climate denying Congress members). Canada was perceived and performed in the top 10.
Corporate sustainability forms an important component of this index parameter.
“Global and local companies have carbon and natural capital footprints, as well as supply chains that when reoriented to more sustainable pathways can have spillover effects on the local markets where they operate… In many countries with otherwise lackluster GGEI results – like the United States, Australia, Japan and South Korea – the corporate sector is more engaged with sustainability reporting. In many developing countries, there is limited evidence of sustainability reporting from top companies.”—GGEI, 2016
Environment
The GGEI calculates environmental performance based upon the results from the recently released Environmental Performance Index (EPI), published by Yale University. The Nordic countries, Austria, Germany and Switzerland perform well, as do other EU nations, notably Slovenia, Portugal, Croatia, France and Greece. As the EPI points out, the social implications of development can often play out differently in Air Quality and Water, something illustrated clearly through China’s ranking almost last for Air Quality, and somewhat better for Water Treatment & Access. Other rapidly developing economies like Ethiopia and Thailand score poorly on both measures.
Other sub-categories of the Environment dimension produce some counter-intuitive results. The generally high performing Nordic countries actually perform quite poorly on the Forests sub-category (with the exception of Iceland). Some central and eastern European countries – including Hungary, Slovenia, Estonia and Poland – score quite well on Biodiversity. Others – including the United Kingdom, Ireland, Denmark and the Netherlands – rank near the bottom on the Fisheries sub-category. It was not clear how Canada performed in these areas from the GGEI report.
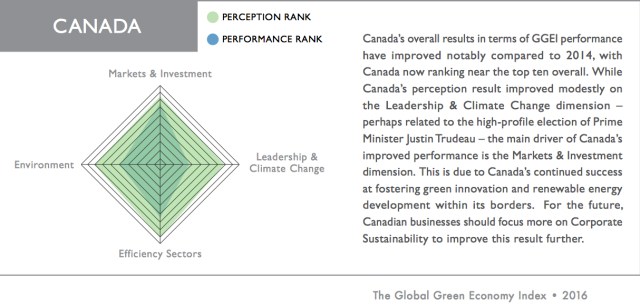
However, below is the GGEI summary for Canada in 2016:
“Canada’s overall results in terms of GGEI performance have improved notably compared to 2014, with Canada now ranking near the top ten overall. While Canada’s perception result improved modestly on the Leadership & Climate Change dimension – perhaps related to the high-profile election of Prime Minister Justin Trudeau – the main driver of Canada’s improved performance is the Markets & Investment dimension. This is due to Canada’s continued success at fostering green innovation and renewable energy development within its borders. For the future, Canadian businesses should focus more on Corporate Sustainability to improve this result further.”—GGEI, 2016


REFERENCES:
Tamanini, et. al. 2016. “The Global Green Economy Index, 2016: Measuring National Performance in the Green Economy” Online: dualcitizen.com/GGEI-2016.pdf.
Follow Dual Citizen Inc. on Twitter: @DualCitizenInc.
 Nina Munteanu is an ecologist, limnologist and internationally published author of award-nominated speculative novels, short stories and non-fiction. She is co-editor of Europa SF and currently teaches writing courses at George Brown College and the University of Toronto. Visit www.ninamunteanu.ca for the latest on her books.
